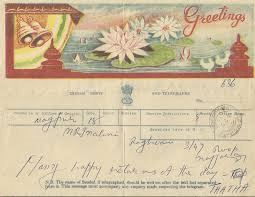
 The last telegram in India was sent at 11.45 p.m. on the 14th of July, 2013. The telegram service in the country started in 1850 on an experimental basis, and was made available to the public in 1854. It connected us across the vast country, the harbinger of joys and sorrows. The arrival of a telegram definitely did give rise to butterflies in the stomach and a rise in blood pressure.
But there was a class of telegrams called ‘Greetings Telegrams’, which brought only joy. The Postal Department had kindly put together greetings-phrases to cover many occasions, and one had to only choose the number and the message would be handed over to the recipient in a specially-designed happy format.
What struck me when I recently went through the list of greetings telegrams was a sense of India—all our celebrations and special occasions—religious and secular, national and personal. The list obviously does not cover the entire gamut. But one can see the effort for inclusivity—whether of religion or community or region. And also a sense of evolving sensitivity. Additions of Parushan, Ravidas Purnima, Bihu or Ugadi at later numbers do definitely indicate this evolving sensitivity to me.
The intriguing ones are of course the ones on elections!
No. 100 on the list was a condolence message, something often needed but only informally on the ‘Greetings’ list!
Today, this list and its evolving nature might be called political correctness at best (tokenism, appeasement or pseudo-secularism would also definitely be bandied), but for me, it is my India! Here is the list:
- Heartiest Diwali Greetings (1)
- Id Mubarak (2)
- Heartiest Bijoya Greetings (3)
- A Happy New Year To You (4)
- Many Happy returns of the day (5)
- Hearty Congratulations on the new Arrival (6)
- Congratulations on the Distinction conferred on you (7)
- Best Wishes for a long and Happy married life (8)
- A Merry Christmas to you (9)
- Hearty Congratulations on your success in the Examination (10)
- Best Wishes for a safe and pleasant journey (11)
- Hearty Congratulations for your success in Election (12)
- Many Thanks for your good wishes which i/we Reciprocate Most Heartily (13)
- Congratulations (14)
- Loving Greetings (15)
- May Heaven’s Choicest Blessings be showered on the young couple (16)
- Wish you both a happy and prosperous wedded life (17)
- Kind Remembrances and all Good Wishes for the Independence Day (18)
- Sincere Greetings for the Republic Day Long Live the Republic (19)
- My Heartiest Holi Greetings to you (20)
- Wishing the function every success (21)
- Many thanks for your kind message of Greetings (22)
- Best Wishes for your successes in the examination (23)
- Best Wishes for your success in Elections
- Convey our blessings to the newly married couple (25)
- Heartiest Pongal Greetings (26)
- Heartiest Gur Purb Greetings (27)
- Greetings on the occasion of Parvushan-a day of universal forgiveness (28)
- Heartiest Onam Greetings (29)
- Best Wishes on your wedding anniversary (30)
- Wish you a happy retired life (31)
- Wish you a speedy recovery (32)
- Heartiest Ugadi Greetings (33)
- Congratulations on your victory (34)
- Wish you a Happy Bihu (35)
- A Happy Easter (36)
- Heartiest Greetings on Buddha Jayanti (37)
- Heartiest Congratulations on Greh Pravesh (38)
- Heartiest Guru Ravidas Purnima Greetings (39)
- Heartiest Greetings on Navroj
- Heartiest Greetings on the Occasion of Jhulelal Jayanti
- Healthiest Greetings on the Occasion of Makarsankranti
- Healthiest Greetings on the Occasion of Chatrapatimaharaja Shri Agrasen Jayanti
–Meena


 Over 30 years ago.
 y for an environmental educator whose work and mantra for over three decades had been ‘connecting children with nature’. Environmental education as we believed was learning in the environment, learning through the environment, and for the environment. More than anything else, this was true for nature education. Based on this conviction we worked with passion and imagination to create hands-on teaching-learning experiences–from stepping outside the classroom to observe a single tree, to a camping experience of immersion in natural surroundings. These were experiences that engaged not just the head, but all the five senses—seeing, hearing, smelling, tasting and feeling—and thence the heart. We believed that it was the heart and not the head which would create a new generation of sensitive, informed and able champions of the environment.
 ies, just to pick up a book. One went to feast on the shelves lined with books, to run one’s eye across and up and down, pulling out a familiar name, or a new unfamiliar one; to peruse the blurbs on the cover to get a taste of what was within. One went in, sometimes with the certainty of coming out with a specific title, but equally the expectation of discovering new authors, or new works by familiar authors. It was the exploration that was the real fun, not so much the final selection.
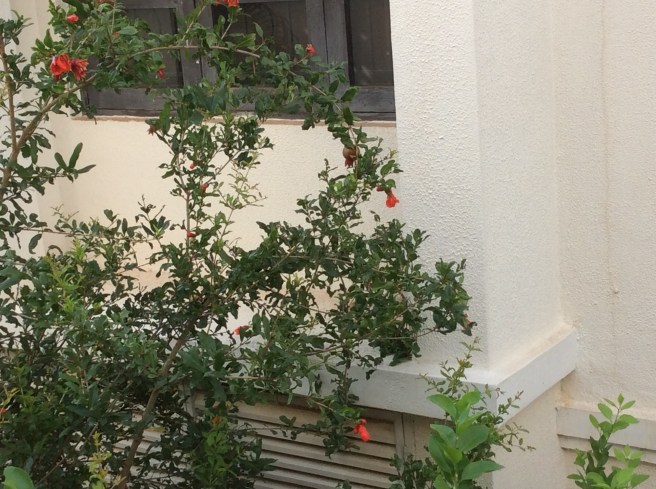 Lockdown has certainly make us more observant and has given us new ways of looking at things. There is a pomegranate tree whose top I can see from my window—and considering I spend eight or nine hours working in that room, it is very central to my vision! It is currently flowering, abuzz with bees, and fruits have started forming.
 The pomegranate is a symbol of resurrection and life everlasting in Christian art, and the pomegranate is often found in devotional statues and paintings of the Virgin and Child, as in Bottecelli’s ‘Madonna of the Pomegranate’ shown here.
