In the education space, stakeholders in India ( at least private
schools and ’learning solution providers’) have moved to E-learning. An estimate is that overall, technology adoption has been accelerated by upto two decades,
thanks to COVID.
Two things stand out. We would not have done it, if we did not have to
do it! While online tutoring had caught on in a big way, educational
institutions were definitely not leveraging technology to the extent
it should have happened—till COVID. The other, more heartbreaking, is
that this is adding to the already stark inequity in educational
access. The point is not to deny access to some because it cannot be
universal. The point is rather to go on a mission to make it
universal!
In contrast—SITE (Satellite Instructional Television Experiment)
undertaken by India in 1975, was a proactive effort to use technology
for education and development communication for the most-unreached.
Imagine 1975, when TVs were hardly seen even in urban households. Here
was an unimaginably bold initiative to take TV to 2400 of India’s most
backward villages in 6 states.
There were questions even apart from our technical ability to do this—was such an experiment necessary for a country at our level of poverty and problems? Surely, there were more pressing problems and more immediate use for the scarce resources? But the conviction of a team led by Dr. Vikram Sarabhai, that technology-leapfrogging was critical to solve India’s development challenges,
ensured that the topmost decision makers saw the advantages and they
could make it happen. (‘Technology-leapfrogging occurs when
decision-makers choose to adopt leading-edge technology, skipping one
or more technology generations’).
This was a NASA-ISRO partnership with the objective of using technology for the education of communities in the most deprived and unreached parts of the country . A NASA broadcasting satellite was used. In the first-ever Indo-US space collaboration, it was positioned over India for the
duration of the experiment (August 1, 1975 to July 1976). The
deeply-researched content on critical issues faced by the community,
from agriculture and health, to culture to short films promoting
scientific temper, the production was done mainly by All India Radio,
with social research and evaluation done by a special team from ISRO,
and with the involvement of experts from a range of the most
significant institutions of India-Tata Institute of Social Sciences, to NCERT. Apart from community programs, there was a rich variety of special educational programs for schools as also massive teacher training.
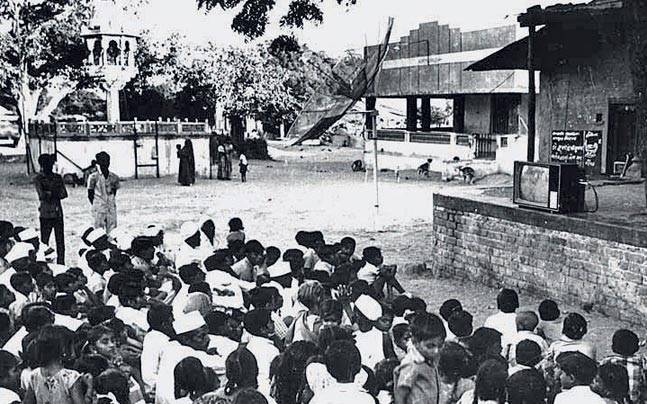 The programs were broadcast for a few hours a day, and hundreds of
people would gather in the village community hall or wherever the
village had installed the TV. In villages which did not have
electricity, truck or car batteries were used to power the viewing.
People in remote Bihar were watching television while many in Delhi
had never seen one!
SITE was a resounding success in proving that technology had a huge
role to play in solving the real development challenges of the
country. It helped ISRO develop its capabilities in operational
satellite systems and contributed to a sound platform for the Indian
National Satellite System (INSAT). It helped us develop an
understanding of educational software programming, from social
research to production to evaluation. And it helped develop managerial
capacities. It was probably also the first time in India that a very
young group (mainly in their 20s) formed the core of the team taking
responsibility for such a complex task of national importance.
Well-known science fiction writer Arthur C. Clarke called SITE ‘the
greatest communication experiment in history’.
So even as education (for some) moves online, here is a Hurrah for the vision of the
giants on whose shoulders we stand! Can that infuse us once again?
And a Hurrah from the Millennial Matriarchs for some of the amazing
people who were part of SITE, whom we have had a chance to interact
with—Prof. Yashpal, Kiran Karnik, BS Bhatia, Binod Agarwal,
Vishwanath, Mira Aghi—to name just a few. We are thankful to life for
giving us these opportunities.
–Meena
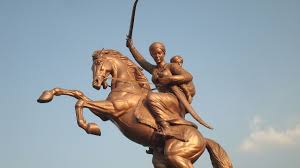
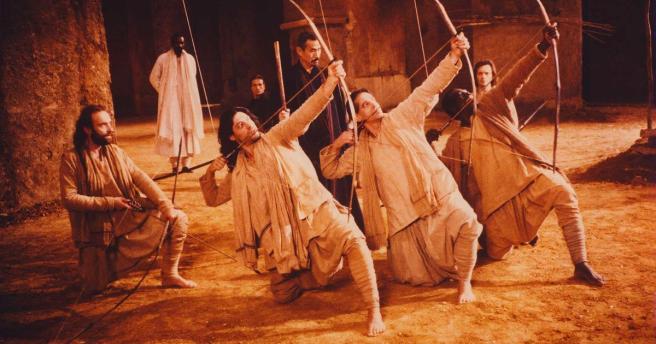
 On the day of the challenge, Amaravathi positioned herself behind a curtain, out of sight of her lover. She had at her side two baskets. One was empty and the other had a hundred beautiful blossoms (I visualize them to be jasmine). The idea was that as Ambikapathy finished a verse, she would transfer one flower from the filled basket to the empty one. When the basket was empty, she would know that he had finished his 100 verses and she could appear before him.
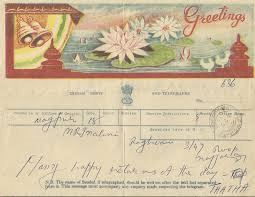 The last telegram in India was sent at 11.45 p.m. on the 14th of July, 2013. The telegram service in the country started in 1850 on an experimental basis, and was made available to the public in 1854. It connected us across the vast country, the harbinger of joys and sorrows. The arrival of a telegram definitely did give rise to butterflies in the stomach and a rise in blood pressure.
 Over 30 years ago.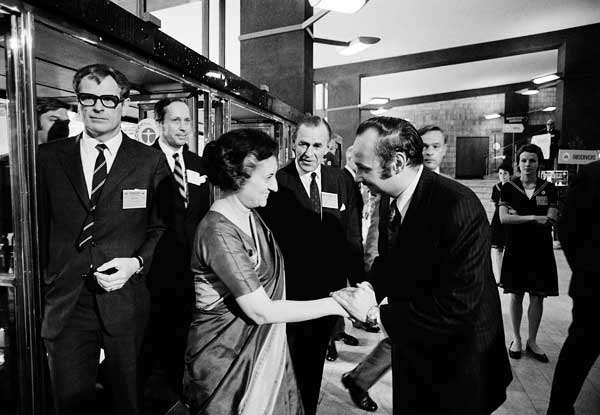
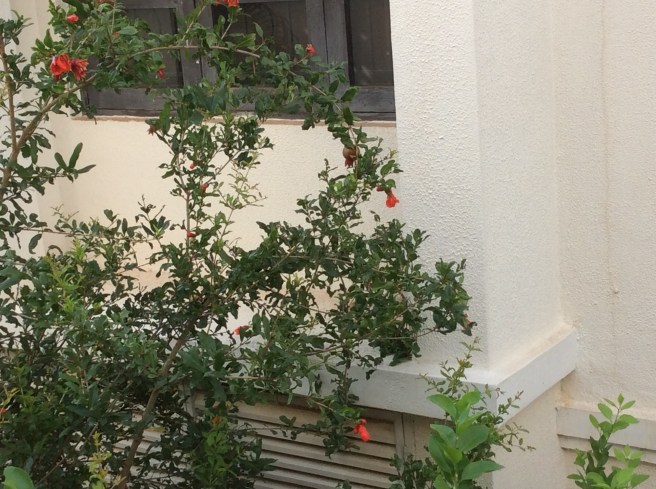 Lockdown has certainly make us more observant and has given us new ways of looking at things. There is a pomegranate tree whose top I can see from my window—and considering I spend eight or nine hours working in that room, it is very central to my vision! It is currently flowering, abuzz with bees, and fruits have started forming.
 The pomegranate is a symbol of resurrection and life everlasting in Christian art, and the pomegranate is often found in devotional statues and paintings of the Virgin and Child, as in Bottecelli’s ‘Madonna of the Pomegranate’ shown here.
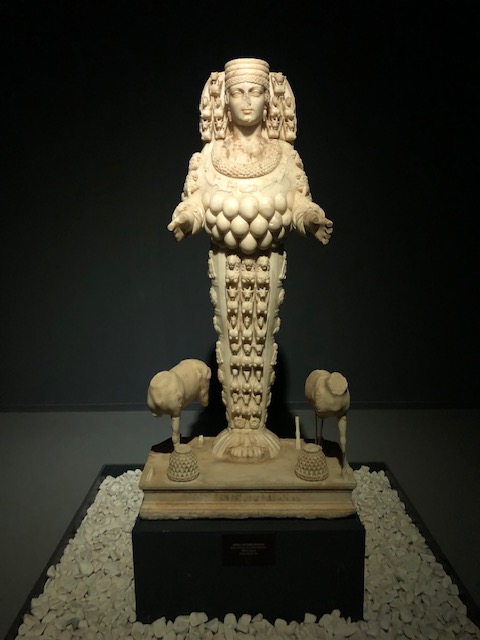 Why the sudden question? Well, because May 18th is International Museum Day—observed as such since since 1977. The idea is that on this day, museums engage with their stakeholders and highlight the importance of the role of museums as institutions and the role they play in society.
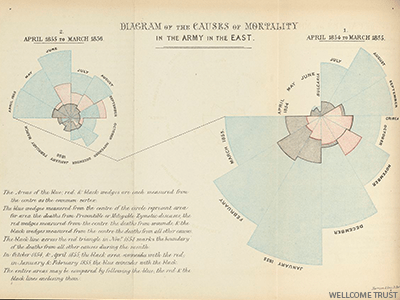 Florence was also one who shook up systems and brought in systemic changes. She battled with entrenched bureaucracies most of her working life, in order to bring about these changes. She was aware that it would be difficult to convince decision makers of the need for change, and maybe out of this requirement was born what is today counted as her major contribution to statistics—the first infographics ever made. The best-known of the infographics she invented are what are called the “coxcomb” diagrams, understandable by even the public. ‘The coxcomb is similar to a pie chart, but more intricate. In a pie chart the size of the ‘slices’ represent a proportion of data, while in a coxcomb the length which the slice extends radially from the center-point, represents the first layer of data. The specific organization of Nightingale’s chart allowed her to represent more complex information layered in a single space. In her coxcomb during the Crimean War, the chart was divided evenly into 12 slices representing months of the year, with the shaded area of each month’s slice proportional to the death rate that month. Her color-coding shading indicated the cause of death in each area of the diagram.’*
 Millennial Matriarchs