 Why the sudden question? Well, because May 18th is International Museum Day—observed as such since since 1977. The idea is that on this day, museums engage with their stakeholders and highlight the importance of the role of museums as institutions and the role they play in society.
And as with everything else, Corona is forcing us to re-examine many things that we took for granted.
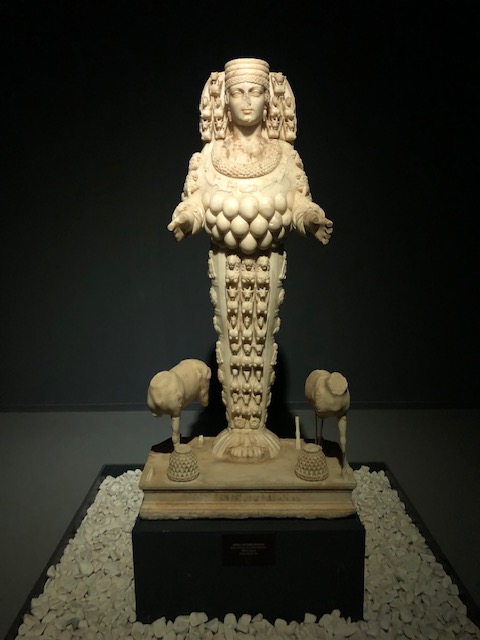
Statue of Artemis, Ephesus Museum, Turkey
And museums are one of them. A museum is ‘a building or place where works of art, scientific specimens, or other objects of permanent value are kept and displayed’. There are over 55,000 museums in the world.
How many will survive COVID?
Museums by their very nature are places which need to be visited by the public—in other words, queues, groups, crowds. What shape will that take in the post-COVID world? Surely there will be a fall in numbers visiting.
Moreover, of recent years, many exhibits in museums are interactive—requiring you to press buttons, handle things, etc. All of that will have to be re-conceived. That will cost money. Financially, some may be able to survive, while others may be forced to shut down.
And there is another threat—the threat to the security of artefacts and exhibits during this time. Already, on 6th April, thieves forced open the glass doors of the Singer Laren museum in the Netherlands and made off with its most valuable exhibit, a Van Gogh oil painting called “Spring Garden, the Parsonage Garden in Nuenen in Spring”. The theft highlights concerns of having high-value items in unattended locations as entire regions lock down.
On the other hand, many museums are re-inventing themselves, and taking the occasion of lockdown to go online. Several already had virtual tours, but many others are putting their exhibits online and developing virtual ways for audiences to see and experience them. Many including the Smithsonian have already made a number of tours available online.
Even more interesting is the effort of some museums to study and preserve the experiences of COVID even as it is happening. The Victoria and Albert Museum for instance is preparing to launch Pandemic Objects, an online series examining how a range of unremarkable items have become charged with new meaning and purpose. The exhibition will capture things like the variety of homemade signs cropping up in shop windows around the world, explaining new delivery services and warning people to keep 2m apart. Another focus of this exhibition will be to examine if the pandemic is revealing something new about things that are normally taken for granted. For instance, the upsurge in baking and related activities. The series is likely to examine why this should be so—it is not as if bread is not available. Why then has baking become so popular—maybe the ‘tactile and meditative quality of the process, along with a desire to feel self-sufficient’ asBrendan Cormier, senior design curator says?
There will be a new normal in museums as in everything else. Museums as buildings to be visited may go down in popularity, but the re-interpretation of “museums as an important means of cultural exchange, enrichment of cultures and development of mutual understanding, cooperation and peace among peoples” will become even more relevant than before.
–Meena
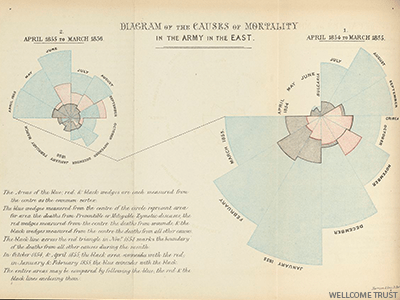 Florence was also one who shook up systems and brought in systemic changes. She battled with entrenched bureaucracies most of her working life, in order to bring about these changes. She was aware that it would be difficult to convince decision makers of the need for change, and maybe out of this requirement was born what is today counted as her major contribution to statistics—the first infographics ever made. The best-known of the infographics she invented are what are called the “coxcomb” diagrams, understandable by even the public. ‘The coxcomb is similar to a pie chart, but more intricate. In a pie chart the size of the ‘slices’ represent a proportion of data, while in a coxcomb the length which the slice extends radially from the center-point, represents the first layer of data. The specific organization of Nightingale’s chart allowed her to represent more complex information layered in a single space. In her coxcomb during the Crimean War, the chart was divided evenly into 12 slices representing months of the year, with the shaded area of each month’s slice proportional to the death rate that month. Her color-coding shading indicated the cause of death in each area of the diagram.’*
 In the case of demarcation of COVID zones in India, Orange is the New Freedom! Lucky enough to fall into this zone, I can now do some things I could not last week. But since my neighbouring zone 5 kms away is Red, there is nothing very exciting I can do. But I suppose it is all in the mind.
 Polio was a dreaded disease in the early 20th century. It left death in its wake, but even more, it paralysed. Till date, there is no cure for polio, and the only defence is vaccination. Jonas Salk rightly deserves the credit for the polio vaccine, but there were two women, without whose work things would not have happened as they happened, when they happened. One was Dr. Isabel Morgan of Johns Hopkins University, whose work was a turning point in understanding host immunity to polio and on use of killed-virus (vs. live-virus) as the basis of vaccines for this disease. The other was Dr. Dorothy Horstmann of Yale and her team, whose work is said to have paved the way for oral polio vaccines.
 But that is not the subject of the blog today. April 25th is marked as World Penguin Day, and that is the occasion of the blog. This day coincides with the annual northern migration of Adelie penguins.
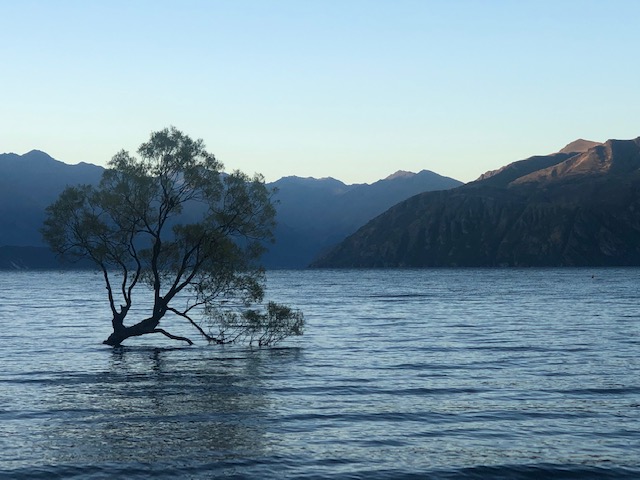 The connection is a tree that is reputed to be the most instagrammed tree in New Zealand, almost a symbol of NZ tourism. On a recent trip there, we were urged to set aside time to see the tree, specifically around sunset. So we worked around our program to ensure we got to the spot—a stretch of a beach—well ahead. We drove past a few times, keenly looking at the beach. We could see some people, but nothing special in the way of trees. We asked natives and tourists alike, and they all pointed us to the same area which our GPS had shown us, and which we had passed, looking in vain for a landmark. We decided to make our way down to the beach anyway. Lo and behold, there were many, many people there, jostling for some spot (we could not figure out what the spot was for), all setting up professional looking camera equipment. It came to a pass when we had to ask a friendly-looking lady what everyone was waiting to photograph, where the famous tree was, and what it was about. She kindly pointed to this spindly willow tree, standing a few feet into the waters of the beautiful Wanaka Lake, against a beautiful background of majestic mountains. But the tree itself? In my mind, this will forever define and exemplify ‘under-whelming’. ‘Why is the tree famous’, we asked many around us in bewilderment. While there was some story of how it was part of a fence and had survived in the water for several years, the general consensus was that it was famous because it was famous! So famous , it even has its own insta handle #ThatWanakaTree.
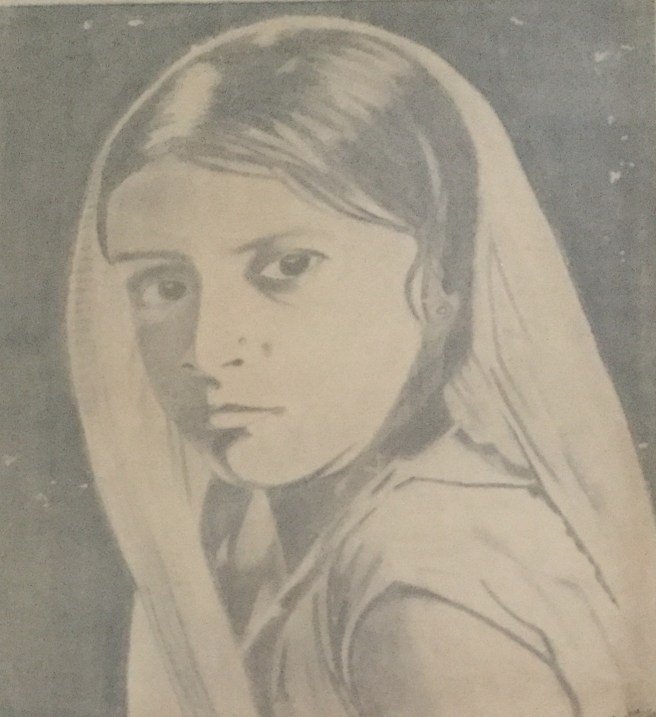 Pencil sketch, V. Raghunathan, using 3B and 4B pencils. 1980.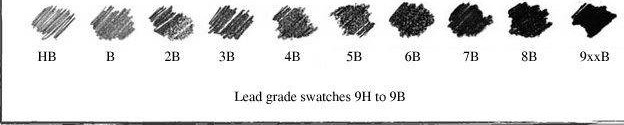
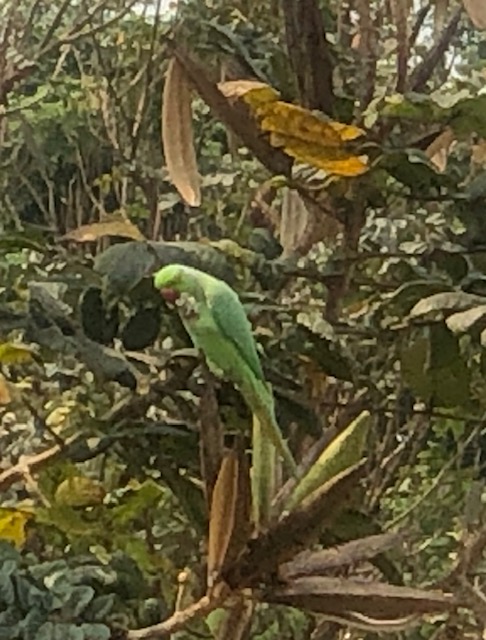
 AESTIVATION, lesser known cousin of hibernation, is ‘summer sleep’– a survival strategy used by many vertebrates and invertebrates to endure arid environmental conditions. Key features of aestivation, like hibernation (winter dormancy) include significant metabolic rate suppression, conservation of energy , altered nitrogen metabolism, and mechanisms to preserve and stabilize organs and cells over many weeks or months of dormancy. Even more than in hibernation, strategies to retain body water are important in aestivation, as dryness or aridity is the key trigger for the summer sleep.
